GST collection of Gujarat for Feb 2025 up 3% compared to Feb 2024
March 01, 2025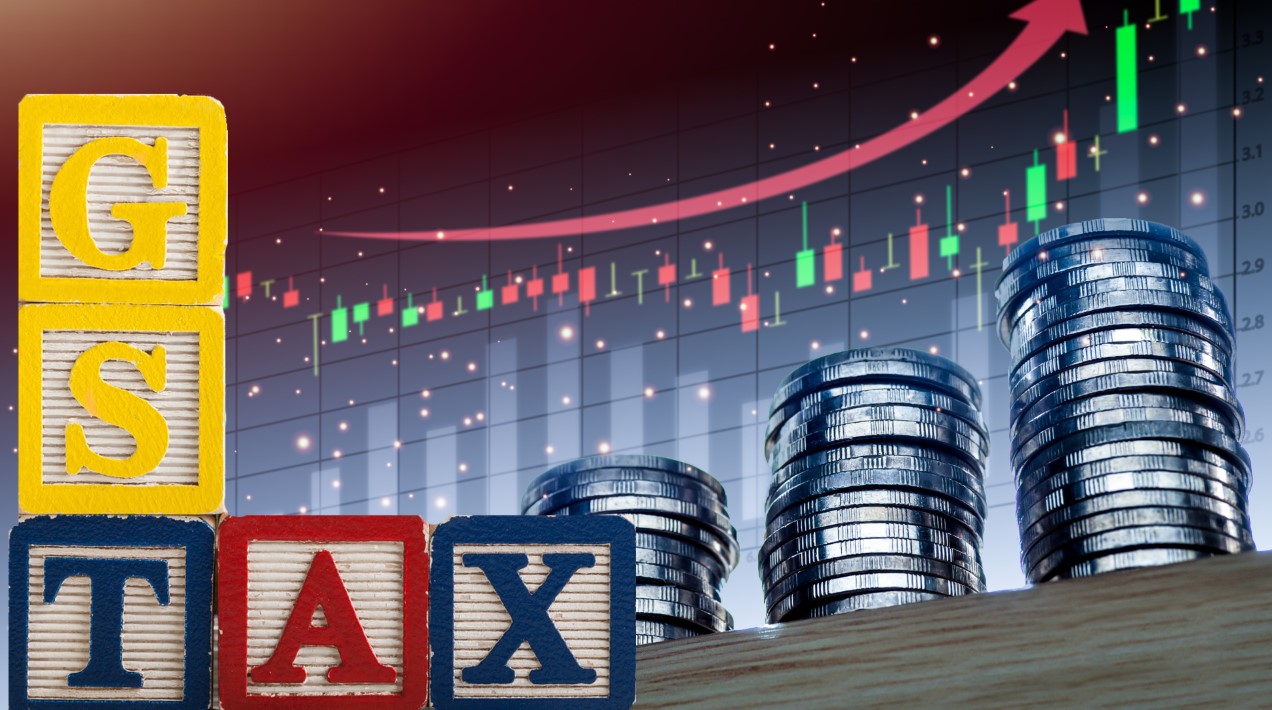
Gandhinagar: In February 2025, Gujarat’s Goods and Services Tax (GST) revenue increased by 3% compared to the same month last year (2024). According to the central government’s latest data, the state’s GST collection rose from ₹11,029 crore in February 2024 to ₹11,402 crore in February 2025.
Meanwhile, the state recorded a collection of ₹1,24,654 crore in the 11 months of this financial year, from April 2024 to February 25, 2025.
Although the figures released by the central government are provisional and may slightly vary upon finalization, indirect tax collection has shown growth at both the state and national levels. DeshGujarat
| GST Gross and Net Collections as on 28/02/2025 (Amount in crores) | ||||||
| Monthly | Year To Date | |||||
| GST Collections | Feb-24 | Feb-25 | % Growth | Feb-24 | Feb-25 | % Growth |
| A | B | C | D = C/B-1 | E | F | G = F/E-1 |
| A.1. Domestic | ||||||
| CGST | 31,785 | 35,204 | 3,41,178 | 3,75,631 | ||
| SGST | 39,615 | 43,704 | 4,27,449 | 4,66,557 | ||
| IGST | 45,505 | 50,049 | 4,96,079 | 5,53,511 | ||
| CESS | 11,854 | 12,987 | 1,21,376 | 1,30,776 | ||
| Gross Domestic Revenue | 1,28,760 | 1,41,945 | 10.2% | 13,86,083 | 15,26,474 | 10.1% |
| A.2. Imports | ||||||
| IGST | 38,593 | 40,821 | 4,42,764 | 4,75,971 | ||
| CESS | 984 | 880 | 10,919 | 10,274 | ||
| Gross Import Revenue | 39,578 | 41,702 | 5.4% | 4,53,683 | 4,86,245 | 7.2% |
| A.3. Gross GST Revenue(A.1+A.2) | ||||||
| CGST | 31,785 | 35,204 | 3,41,178 | 3,75,631 | ||
| SGST | 39,615 | 43,704 | 4,27,449 | 4,66,557 | ||
| IGST | 84,098 | 90,870 | 9,38,843 | 10,29,482 | ||
| CESS | 12,839 | 13,868 | 1,32,295 | 1,41,050 | ||
| Total Gross GST Revenue | 1,68,337 | 1,83,646 | 9.1% | 18,39,766 | 20,12,720 | 9.4% |
| B.1. Domestic Refunds | ||||||
| CGST | 2,248 | 2,607 | 26,929 | 30,873 | ||
| SGST | 2,867 | 3,083 | 33,429 | 38,977 | ||
| IGST | 3,311 | 4,808 | 48,118 | 51,063 | ||
| CESS | 296 | 269 | 2,039 | 2,720 | ||
| Refund – Domestic | 8,722 | 10,766 | 23.4% | 1,10,514 | 1,23,633 | 11.9% |
| B.2. Export GST Refunds through ICEGATE | ||||||
| IGST | 8,991 | 10,005 | 89,399 | 1,07,907 | ||
| CESS | 96 | 118 | 1,502 | 1,673 | ||
| Refund – Imports | 9,088 | 10,123 | 11.4% | 90,901 | 1,09,581 | 20.5% |
| B.3. Total Refund (B.1+B.2) | ||||||
| CGST | 2,248 | 2,607 | 26,929 | 30,873 | ||
| SGST | 2,867 | 3,083 | 33,429 | 38,977 | ||
| IGST | 12,302 | 14,813 | 1,37,516 | 1,58,970 | ||
| CESS | 393 | 386 | 3,541 | 4,394 | ||
| Total Refund | 17,810 | 20,889 | 17.3% | 2,01,415 | 2,33,214 | 15.8% |
| C.1 Net Revenue Domestic (A.1 – B.1) | ||||||
| CGST | 29,537 | 32,597 | 3,14,249 | 3,44,758 | ||
| SGST | 36,749 | 40,621 | 3,94,020 | 4,27,580 | ||
| IGST | 42,194 | 45,241 | 4,47,961 | 5,02,448 | ||
| CESS | 11,558 | 12,719 | 1,19,337 | 1,28,056 | ||
| Net Domestic Revenue | 1,20,038 | 1,31,178 | 9.3% | 12,75,568 | 14,02,841 | 10.0% |
| C.2 Net Revenue Customs (GST) (A.2 – B.2) | ||||||
| IGST | 29,602 | 30,816 | 3,53,365 | 3,68,064 | ||
| CESS | 888 | 763 | 9,417 | 8,601 | ||
| Net Customs Revenue | 30,490 | 31,579 | 3.6% | 3,62,782 | 3,76,665 | 3.8% |
| C.3 Net Revenue (C.1+C.2)) | ||||||
| CGST | 29,537 | 32,597 | 3,14,249 | 3,44,758 | ||
| SGST | 36,749 | 40,621 | 3,94,020 | 4,27,580 | ||
| IGST | 71,796 | 76,057 | 8,01,327 | 8,70,512 | ||
| CESS | 12,446 | 13,481 | 1,28,754 | 1,36,656 | ||
| Total Net GST Revenue | 1,50,528 | 1,62,758 | 8.1% | 16,38,350 | 17,79,506 | 8.6% |
Note :
The above numbers are provisional and the actuals number may have slightly vary on finalisation
Table 1: State-wise growth of GST Revenues during February, 20251
| State/UT | Feb-24 | Feb-25 | Growth (%) |
| Jammu and Kashmir | 532 | 523 | -2% |
| Himachal Pradesh | 746 | 869 | 16% |
| Punjab | 1,955 | 2,125 | 9% |
| Chandigarh | 211 | 236 | 12% |
| Uttarakhand | 1,525 | 1,656 | 9% |
| Haryana | 8,269 | 9,925 | 20% |
| Delhi | 5,544 | 6,074 | 10% |
| Rajasthan | 4,211 | 4,787 | 14% |
| Uttar Pradesh | 8,054 | 9,155 | 14% |
| Bihar | 1,491 | 1,644 | 10% |
| Sikkim | 299 | 332 | 11% |
| Arunachal Pradesh | 101 | 102 | 1% |
| Nagaland | 51 | 56 | 9% |
| Manipur | 56 | 50 | -9% |
| Mizoram | 49 | 42 | -16% |
| Tripura | 85 | 103 | 21% |
| Meghalaya | 193 | 214 | 11% |
| Assam | 1,390 | 1,451 | 4% |
| West Bengal | 5,357 | 5,797 | 8% |
| Jharkhand | 2,933 | 3,319 | 13% |
| Odisha | 5,136 | 5,344 | 4% |
| Chhattisgarh | 3,124 | 3,351 | 7% |
| Madhya Pradesh | 3,572 | 4,090 | 15% |
| Gujarat | 11,029 | 11,402 | 3% |
| Dadra and Nagar Haveli and Daman & Diu | 355 | 386 | 8% |
| Maharashtra | 27,065 | 30,637 | 13% |
| Karnataka | 12,815 | 14,117 | 10% |
| Goa | 581 | 601 | 3% |
| Lakshadweep | 2 | 1 | -55% |
| Kerala | 2,688 | 2,894 | 8% |
| Tamil Nadu | 9,713 | 10,694 | 10% |
| Puducherry | 231 | 251 | 9% |
| Andaman and Nicobar Islands | 39 | 52 | 32% |
| Telangana | 5,211 | 5,280 | 1% |
| Andhra Pradesh | 3,678 | 3,817 | 4% |
| Ladakh | 35 | 19 | -46% |
| Other Territory | 204 | 214 | 5% |
| Center Jurisdiction | 232 | 336 | 45% |
| Grand Total | 128,760 | 141,945 | 10% |
1 Does not include GST on import of goods
Table-2: SGST & SGST portion of IGST settled to States/UTs till February, 2025 (Rs. in crore)
| Pre-Settlement SGST Post-Settlement SGST2 | ||||||
| State/UT | 2023-24 | 2024-25 | Growth | 2023-24 | 2024-25 | Growth |
| Jammu and Kashmir | 2,680 | 2,735 | 2% | 7,415 | 7,980 | 8% |
| Himachal Pradesh | 2,371 | 2,484 | 5% | 5,138 | 5,682 | 11% |
| Punjab | 7,689 | 8,440 | 10% | 20,240 | 22,721 | 12% |
| Chandigarh | 626 | 710 | 13% | 2,117 | 2,176 | 3% |
| Uttarakhand | 4,934 | 5,321 | 8% | 7,708 | 8,588 | 11% |
| Haryana | 18,568 | 21,274 | 15% | 31,975 | 36,542 | 14% |
| Delhi | 14,235 | 16,247 | 14% | 29,187 | 33,063 | 13% |
| Rajasthan | 15,762 | 16,688 | 6% | 35,505 | 39,971 | 13% |
| Uttar Pradesh | 29,560 | 31,638 | 7% | 69,782 | 77,295 | 11% |
| Bihar | 7,478 | 8,350 | 12% | 24,231 | 26,043 | 7% |
| Sikkim | 387 | 366 | -6% | 877 | 887 | 1% |
| Arunachal Pradesh | 548 | 484 | -12% | 1,721 | 1,634 | -5% |
| Nagaland | 270 | 260 | -4% | 955 | 976 | 2% |
| Manipur | 310 | 320 | 3% | 1,011 | 1,040 | 3% |
| Mizoram | 245 | 241 | -2% | 879 | 855 | -3% |
| Tripura | 455 | 494 | 9% | 1,435 | 1,567 | 9% |
| Meghalaya | 550 | 561 | 2% | 1,557 | 1,639 | 5% |
| Assam | 5,413 | 5,839 | 8% | 13,347 | 14,122 | 6% |
| West Bengal | 21,407 | 21,938 | 2% | 38,335 | 42,821 | 12% |
| Jharkhand | 7,967 | 8,021 | 1% | 11,220 | 12,868 | 15% |
| Odisha | 14,796 | 16,069 | 9% | 22,636 | 23,590 | 4% |
| Chhattisgarh | 7,417 | 8,040 | 8% | 12,450 | 14,329 | 15% |
| Madhya Pradesh | 11,865 | 12,614 | 6% | 30,386 | 33,120 | 9% |
| Gujarat | 38,465 | 41,294 | 7% | 58,317 | 67,007 | 15% |
| Dadra and Nagar Haveli | 599 | 677 | 13% | 1,006 | 1,161 | 15% |
| Maharashtra | 91,584 | 102,844 | 12% | 134,593 | 156,612 | 16% |
| Karnataka | 37,305 | 41,136 | 10% | 68,428 | 75,391 | 10% |
| Goa | 2,137 | 2,381 | 11% | 3,752 | 4,136 | 10% |
| Lakshadweep | 18 | 8 | -57% | 79 | 105 | 32% |
| Kerala | 12,809 | 13,620 | 6% | 28,358 | 30,041 | 6% |
| Tamil Nadu | 37,024 | 41,753 | 13% | 58,904 | 69,093 | 17% |
| Puducherry | 467 | 505 | 8% | 1,255 | 1,392 | 11% |
| Andaman and Nicobar Isl | 191 | 208 | 9% | 487 | 544 | 12% |
| Telangana | 18,175 | 19,470 | 7% | 36,949 | 40,340 | 9% |
| Andhra Pradesh | 12,695 | 13,088 | 3% | 28,873 | 30,286 | 5% |
| Ladakh | 230 | 254 | 11% | 620 | 700 | 13% |
| Other Territory | 218 | 187 | -14% | 1,043 | 829 | -21% |
| Grand Total | 427,449 | 466,557 | 9% | 792,773 | 887,146 | 12% |
2 Post-Settlement GST is cumulative of the GST revenues of the States/UTs and the SGST portion of the IGST settled to the States/UTs
Recent Stories
- Gujarat to Develop Satellite Launchpad Between Kodinar and Diu: Govt
- Portion of Apartment Terrace Collapses in Vadodara; 40 Residents Rescued
- Reliance Industries Inks $3 Billion Green Ammonia Supply Agreement with Samsung C&T
- GMDC Inks MoU with NMDC to Explore Rare Earth Value Chain in Gujarat
- RSS National Meet Highlights Growth, Gujarat Records 1,610 Daily Shakhas